
- What does "cost per MW" actually measure?
- What do the 2026 benchmarks say?
- Why do benchmarks differ by $6 million per MW?
- Where does the money go inside a data center?
- What is pushing data center costs up in 2026?
- Do AI and liquid cooling change the cost per MW?
- How should a contractor use cost per MW before bidding?
- FAQs
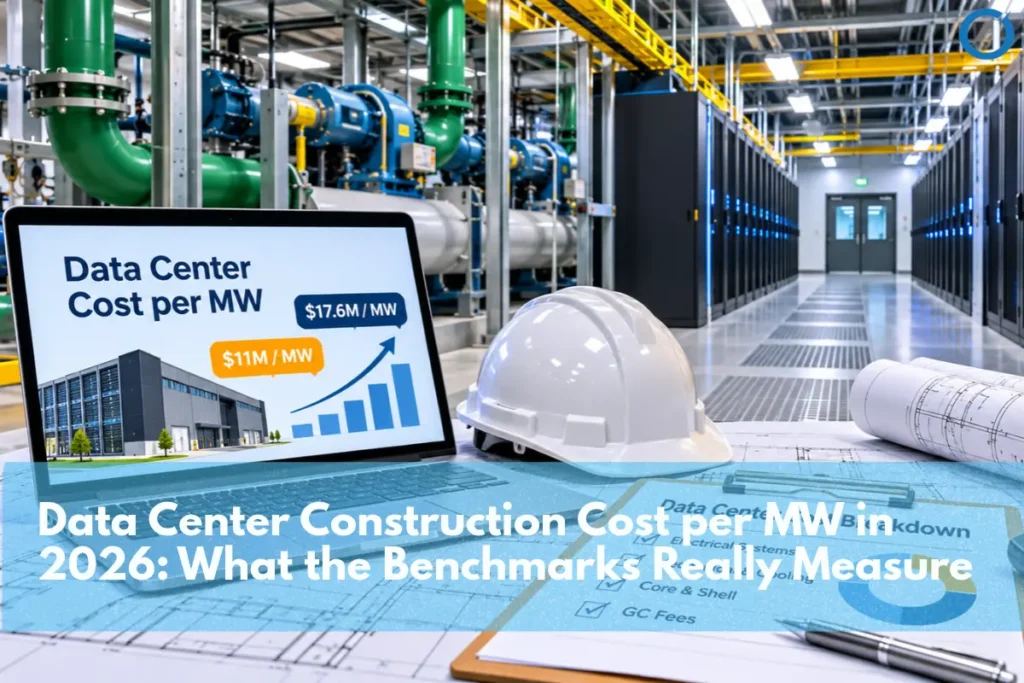
Why would one 2026 benchmark place data center construction costs at around $11 million per megawatt, while the other benchmark places it at $17.6 million? Both are accurate. This is because both are measuring different things, and using these as equals is one of the major pitfalls of the budget for the initial phases of a data center construction project.
In 2026, the published benchmarks state that data center capital cost can be forecasted between $11M and $18M per MW. The latest benchmark by Cushman & Wakefield reveals that the all-in current average for modern greenfield data centers in North America (United States and Canada) is $17.6M per MW (no chips). JLL places the average global cost at $11.3M per MW, while Turner & Townsend puts the price tag on building a 60 MW facility in Chicago at $13.28 per watt.
What does “cost per MW” actually measure?
Cost per MW divides a project’s construction cost by its capacity. The two halves of that fraction are where benchmarks quietly diverge.
The numerator: what is counted as cost
Some estimates apply to the building and MEP systems alone, while others are “all-in” and include site work, utility infrastructure, soft costs, contingencies, and finance. Rarely do any include server hardware, GPU systems, and networking hardware, all of which may be more expensive than the building. Land is the single element that is often overlooked. The estimate by Cushman & Wakefield for powered land in the US in 2026 is $584,000 per MW.
Data Center Preconstruction Services USA help contractors define these scope boundaries before budgeting, so site infrastructure, MEP systems, utilities, takeoffs, and estimating do not get mixed into a misleading cost-per-MW benchmark.
The denominator: which megawatts
A “megawatt” can mean critical IT load, total facility power, or utility capacity. A 60 MW IT facility can need 75–85 MW at the meter once cooling and losses are added. Dividing the same cost by the larger number produces a lower, better-looking figure.
Per watt and per MW are the same unit
Turner & Townsend publishes in US dollars per watt. Because one megawatt is one million watts, $13.28 per watt equals $13.28 million per MW. Converting first avoids a frequent spreadsheet error.
What do the 2026 benchmarks say?
The main published figures, side by side, with the scope each one uses:
| Source (edition) | Headline figure | Scope and basis |
|---|---|---|
| Cushman & Wakefield, Data Center Development Cost Guide (Sept 2026) | $17.6M per MW average | All-in greenfield, most modern facilities, US and Canada, excluding chips and GPUs |
| JLL forecast, reported May 2026 | $11.3M per MW average | Global average construction cost; up 6% year on year and 47% since 2020 |
| Turner & Townsend, Data Center Construction Cost Index (2026 US) | $13.28 per watt, Chicago | Typical 60 MW design; 62 markets; Tokyo highest at $18.28 per watt |
| Turner & Townsend (2025 edition) | $13.3 per watt Silicon Valley; $12.9 per watt New Jersey | Earlier edition; do not mix with 2026 values |
Together, the figures suggest a modern US facility rarely costs less than about $11M per MW to build today, and an all-in greenfield budget will likely land well above that.
Why do benchmarks differ by $6 million per MW?
Five factors explain most of the gap between published figures:
- Scope. All-in development costs include utility works, contingency, and soft costs that construction-only indices leave out.
- Geography. A global average blends lower-cost markets in Asia and elsewhere with high-cost hubs such as Silicon Valley and Tokyo.
- Facility type. A dense AI campus and a conventional colocation building of the same capacity carry different cooling and power scope. 3D BIM Modeling Services help represent these different equipment layouts, structural interfaces, MEP routes, and system requirements before teams move into detailed coordination and quantity extraction.
- Denominator. IT MW versus total facility MW can move the result by 20% or more on its own.
- Timing. Cushman & Wakefield measures a 21% rise per MW since its late-2024 edition, so a two-year-old benchmark is already out of date.
For a deeper look at how redundancy, cooling, electrical infrastructure, fire protection, structural scope, and cabling affect pricing, see our guide to data center cost estimating.
Where does the money go inside a data center?
Unlike an office building, a data center spends most of its budget on the systems that move power and remove heat. Mission Critical Preconstruction Services help project teams coordinate these high-value electrical, cooling, structural, and building-services packages before construction begins. ConstructConnect, citing Turner & Townsend’s 2025 index, reports this typical split:
| Cost category | Typical share of construction cost |
|---|---|
| Electrical systems | 48–54% |
| Mechanical and cooling systems | 22–33% |
| Core and shell | 9–14% |
| General contractor fees | About 10% |
The Cushman & Wakefield breakdown is different but agrees that the power infrastructure is by far the largest expense, at roughly 21%, followed by contingency. Both approaches reach the same conclusion: it’s not the building enclosure but power and cooling that determine a data center’s budget.
What is pushing data center costs up in 2026?
Material inputs, labor, and equipment supply are all moving in the same direction. ConstructConnect’s September 2026 analysis of US producer prices reported these year-on-year increases:
| Input | Year-on-year price change |
|---|---|
| Steel mill products | +22.5% |
| Copper wire | +17.9% |
| Electric power transmission and control equipment | +14.1% |
| Steel pipe and tube | +11.1% |
| Switchgear | +8.5% |
| HVAC and refrigeration equipment | +4.5% |
| Concrete | +3.5% |
Labor is the other pressure point. According to Turner & Townsend’s survey conducted in 2026, 81% of the participants found skilled labor to be restricted to a certain extent, while the company found the price per watt of solar power growing by 13% in North America and Europe each year, which is twice as high as the average growth rate globally at 6%.
Do AI and liquid cooling change the cost per MW?
Yes. Turner & Townsend identified a 7-10% construction cost premium for AI data centers in the US compared with traditional facilities of similar IT capacity. The premium comes from denser power distribution, heavier structural loads, and liquid cooling systems such as coolant distribution units and secondary piping loops. Data Center BIM Modeling Services in USA help coordinate these dense electrical, cooling, structural, and equipment interfaces within a federated model before installation. Supply chains are still catching up: 83% of Turner & Townsend’s respondents said local supply chains are not well prepared for advanced cooling technology.
Dense power and cooling infrastructure also raises coordination risk. Our data center MEP clash detection case study shows how federated model reviews can identify conflicts before construction release.
How should a contractor use cost per MW before bidding?
Cost per MW is a sense check, not an estimate. Preconstruction Services USA can combine BIM, estimating, takeoff, CAD, and documentation support when a contractor needs project-specific information rather than a market benchmark. Before relying on any benchmark, confirm five things:
- Which megawatts the figure divides by: IT load, facility power, or utility capacity.
- Whether land, utilities, soft costs, and contingency will be provided.
- What specific equipment is to be procured by the owner, such as generators, UPS, or chillers, and remove them from your scope.
- The edition date, then escalate the figure to your bid date.
- The market, because wages in Northern Virginia, Dallas, or Phoenix will be very different from an average national figure.
After that adjustment has been done, a benchmark becomes handy to test whether the calculated figure is in a reasonable range. It cannot substitute for the figures found in the drawing, since redundancy design, cooling technology, and phasing make a larger difference than any average does. Construction Takeoff Services provide the measured equipment, material, system, and trade quantities needed to replace benchmark assumptions with project-specific bid information.
FAQs
Published benchmark numbers for 2026 range between $11M and $18M per MW. JLL estimates an average of $11.3M per MW, while Cushman & Wakefield estimates $17.6M per MW of current-generation greenfield facilities in the US and Canada without chips/GPUs.
These are identical measurements in different systems of units. One megawatt is one million watts, which means that $13 per watt is $13 million per MW.
Usually not. IT hardware like servers, GPUs, and networking is not considered in most construction benchmarks and is bought separately by the owner, usually costing more than the facility.
AI facilities need denser power distribution, stronger structures, and liquid cooling. Turner & Townsend measured a 7-10% US construction cost premium for AI data centers over traditional facilities of similar IT capacity.
Electrical systems. Industry breakdowns put electrical work at roughly half of construction cost, followed by mechanical and cooling systems, with the building shell a much smaller share.